
While Simple and Multiple Linear Regression models assume a linear relationship between the variables, Polynomial Regression allows for more complex relationships. It introduces polynomial terms (such as squared or cubed terms) of the independent variable(s) into the regression equation.
Key Concepts
- Non-Linear Relationships: Polynomial Regression can effectively model non-linear relationships between the variables.
- Polynomial Terms: By adding polynomial terms (e.g., x², x³, x⁴) to the regression equation, the model can capture curves and more complex patterns.
- Flexibility: Polynomial Regression offers greater flexibility in fitting the data compared to simple linear regression.
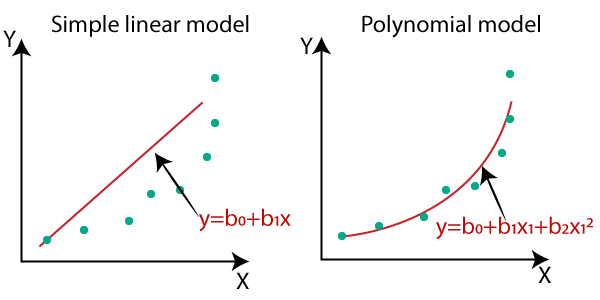
Mathematical Representation (Simple Case)
The equation for a simple polynomial regression with a degree of 2 (quadratic):
y = b0 + b1x + b2x²where:
- y: The predicted value of the dependent variable.
- x: The value of the independent variable.
- b0, b1, b2: The coefficients to be determined.
Example: Predicting Sales with Advertising Spend (Quadratic)
Let’s revisit the sales prediction example, but this time, we suspect a non-linear relationship between advertising spend and sales.
Import necessary libraries:
import numpy as np
from sklearn.preprocessing import PolynomialFeatures
from sklearn.linear_model import LinearRegression
Prepare the data:
X = np.array([[1], [2], [3], [4], [5]]).reshape(-1, 1)  # Independent variable (advertising spend)
y = np.array([10, 15, 18, 20, 25])  # Dependent variable (sales)
Create polynomial features:
polynomial_features = PolynomialFeatures(degree=2)
X_poly = polynomial_features.fit_transform(X)
Create and train the model:
model = LinearRegression()
model.fit(X_poly, y)
Make predictions:
new_advertising_spend = np.array([[6]])
new_advertising_spend_poly = polynomial_features.transform(new_advertising_spend)
predicted_sales = model.predict(new_advertising_spend_poly)
print("Predicted Sales:", predicted_sales)
This code creates polynomial features (x and x²) and then uses the LinearRegression model to fit the data.
Applications of Polynomial Regression
- Modeling non-linear relationships in various fields
- Predicting stock prices with more complex patterns
- Analyzing growth curves
- Image and signal processing
Limitations
- Can overfit the data easily, especially with high degrees.
- May not always provide meaningful interpretations of the coefficients.
- Requires careful selection of the degree of the polynomial to avoid overfitting.
Polynomial Regression extends the capabilities of Linear Regression by allowing for more flexible and complex relationships between variables. By incorporating polynomial terms, it can effectively model curves and capture non-linear patterns in the data. However, it’s crucial to carefully choose the degree of the polynomial to avoid overfitting and ensure a meaningful and interpretable model.


