
Simple Linear Regression is a fundamental statistical method used to model the relationship between two continuous variables. It aims to find the best-fitting straight line that represents the relationship between an independent variable (predictor) and a dependent variable (response).
Linear Regression Key Concepts:
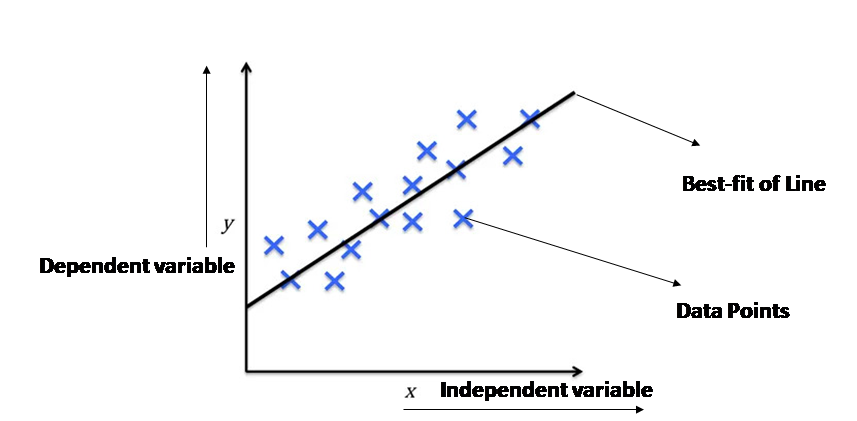
Independent Variable (Predictor): The variable that is believed to influence the dependent variable.
- Example: Years of experience, size of a house, temperature.
Dependent Variable (Response): The variable that we are trying to predict.
- Example: Salary, house price, ice cream sales.
Linear Relationship: The core assumption is that there exists a linear relationship between the two variables. This means that the change in the dependent variable is directly proportional to the change in the independent variable.
Mathematical Representation
The equation for simple linear regression is:
y = b0 + b1*xwhere:
- y: The predicted value of the dependent variable.
- x: The value of the independent variable.
- b0: The intercept (the value of y when x is 0).
- b1: The slope (the rate of change of y with respect to x).

Finding the Best-Fit Line
The goal is to find the values of b0 and b1 that minimize the difference between the actual values of the dependent variable and the predicted values. This is often achieved using the method of least squares, which minimizes the sum of the squared differences between the observed values and the predicted values.
Example: Predicting Sales Based on Advertising Spend
Let’s say we want to predict the sales of a product based on the advertising budget. We have the following data:
| Advertising Spend (in thousands) | Sales (in thousands) |
|---|---|
| 1 | 10 |
| 2 | 15 |
| 3 | 18 |
| 4 | 20 |
| 5 | 25 |
Using a suitable library like scikit-learn in Python, we can:
Import necessary libraries:
import numpy as np
from sklearn.linear_model import LinearRegression
Prepare the data:
X = np.array([[1], [2], [3], [4], [5]]).reshape(-1, 1)  # Independent variable (advertising spend)
y = np.array([10, 15, 18, 20, 25])  # Dependent variable (sales)
Create and train the model:
model = LinearRegression()
model.fit(X, y)
Make predictions:
new_advertising_spend = np.array([[6]])
predicted_sales = model.predict(new_advertising_spend)
print("Predicted Sales:", predicted_sales)
This will give you the predicted sales for an advertising spend of 6 thousand dollars.
Applications of Simple Linear Regression
- Predicting stock prices
- Forecasting sales
- Analyzing the relationship between temperature and ice cream sales
- Determining the impact of study hours on exam scores
Limitations:
- Assumes a linear relationship between the variables.
- Sensitive to outliers.
- May not capture complex non-linear relationships.
Simple Linear Regression is a foundational technique in machine learning and statistics. While its assumptions are relatively straightforward, it provides a valuable framework for understanding the relationship between two variables and making basic predictions.


