
Linear Regression
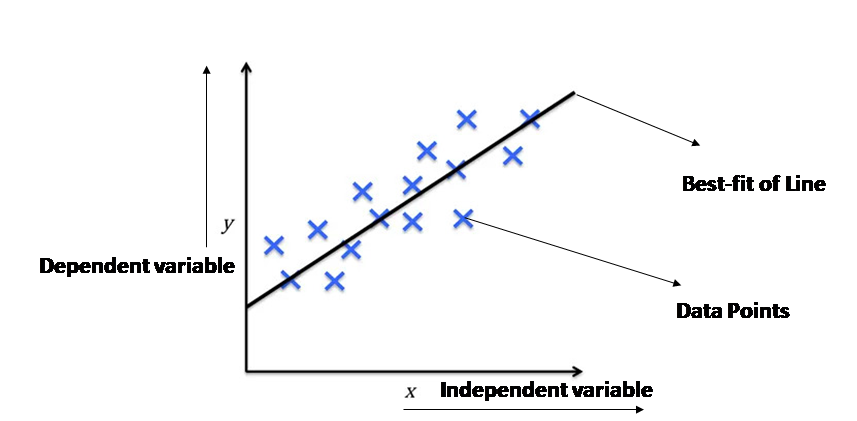
Linear regression is a statistical method used in machine learning to model the relationship between a dependent variable and one or more independent variables. It aims to find the best-fitting line (or hyperplane in the case of multiple variables) that represents the relationship between the variables. This line is then used to make predictions.
Key Concepts
- Prediction: Linear regression primarily focuses on predicting the value of the dependent variable based on the values of the independent variables.
- Line of Best Fit: The goal is to find the line that minimizes the distance between the actual data points and the predicted values on the line. This is often achieved using the method of least squares.
- Assumptions: Linear regression relies on certain assumptions about the data, such as linearity, independence of errors, homoscedasticity (constant variance of errors), and normality of errors.
Types of Linear Regression
1. Simple Linear Regression
Simple linear regression is a type of regression analysis in which we try to predict the value of a dependent variable based on a single independent variable. For example, we might try to predict a person’s salary based on their years of experience.
- Involves one independent variable and one dependent variable.
- Represents a straight-line relationship between the variables.
- Example: Predicting a student’s score based on the number of hours they studied.
2. Multiple Linear Regression
Multiple linear regression involves predicting a dependent variable based on multiple independent variables. For example, we might try to predict a person’s salary based on their years of experience, education level, and job title.
- Involves multiple independent variables and one dependent variable.
- Represents a multi-dimensional relationship between the variables.
- Example: Predicting a house price based on its size, location, number of bedrooms, and age.
What are Dependent and Independent Variables?
Independent Variable
This is the variable that you believe has an impact on the outcome. In other words, it’s the factor you’re using to make a prediction.
For example:
- In predicting house prices: Size of the house, number of bedrooms, location.
- In predicting student grades: Hours of study, attendance, past performance.
Dependent Variable
This is the variable you’re trying to predict. It’s the outcome that’s influenced by the independent variable(s).
For example:
- In predicting house prices: The actual selling price of the house.
- In predicting student grades: The final exam score.

Positive and Negative Correlation
Positive Correlation: When one variable increases, the other variable also tends to increase.
Example: As the number of hours studied increases, the exam score tends to increase.
Negative Correlation: When one variable increases, the other variable tends to decrease.
Example: As the temperature increases, the sales of hot beverages tend to decrease.

Applications of Linear Regression
- Finance: Predicting stock prices, forecasting market trends.
- Healthcare: Analyzing patient data to predict disease risk, determining the effectiveness of treatments.
- Marketing: Predicting customer churn, optimizing advertising campaigns.
- Social Sciences: Studying the impact of social factors on various outcomes.
Advantages of Linear Regression
- Relatively simple to understand and implement.
- Can be used for both prediction and interpretation of relationships between variables.
- Provides a solid foundation for more complex machine learning models.
Limitations of Linear Regression
- Assumes a linear relationship between variables, which may not always hold true in real-world scenarios.
- Sensitive to outliers in the data.
- May not capture complex non-linear relationships.


