
In the realm of machine learning, particularly in classification problems, evaluating model performance is crucial. One of the most fundamental tools for this purpose is the Confusion Matrix.
What is a Confusion Matrix?
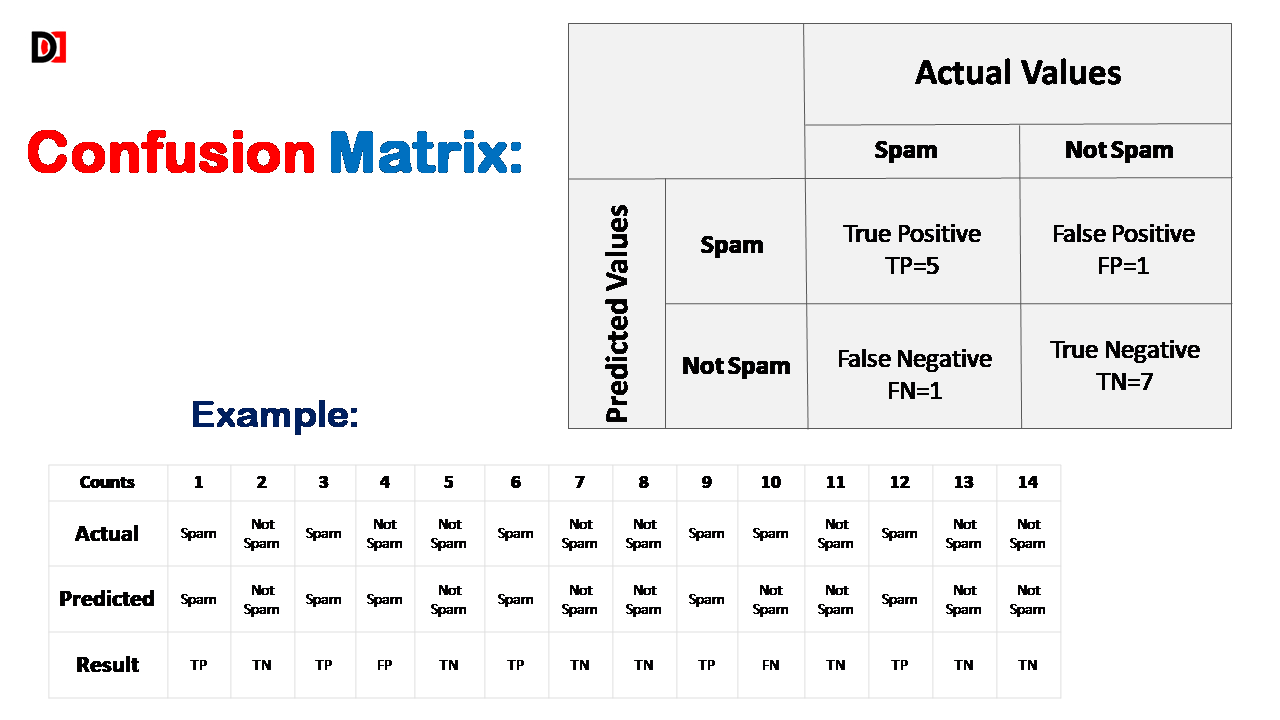
Think of it as a visual summary of your model’s predictions. A confusion matrix is a table that breaks down the model’s performance by comparing its predictions with the actual ground truth labels. It helps you understand the types of errors your model is making.
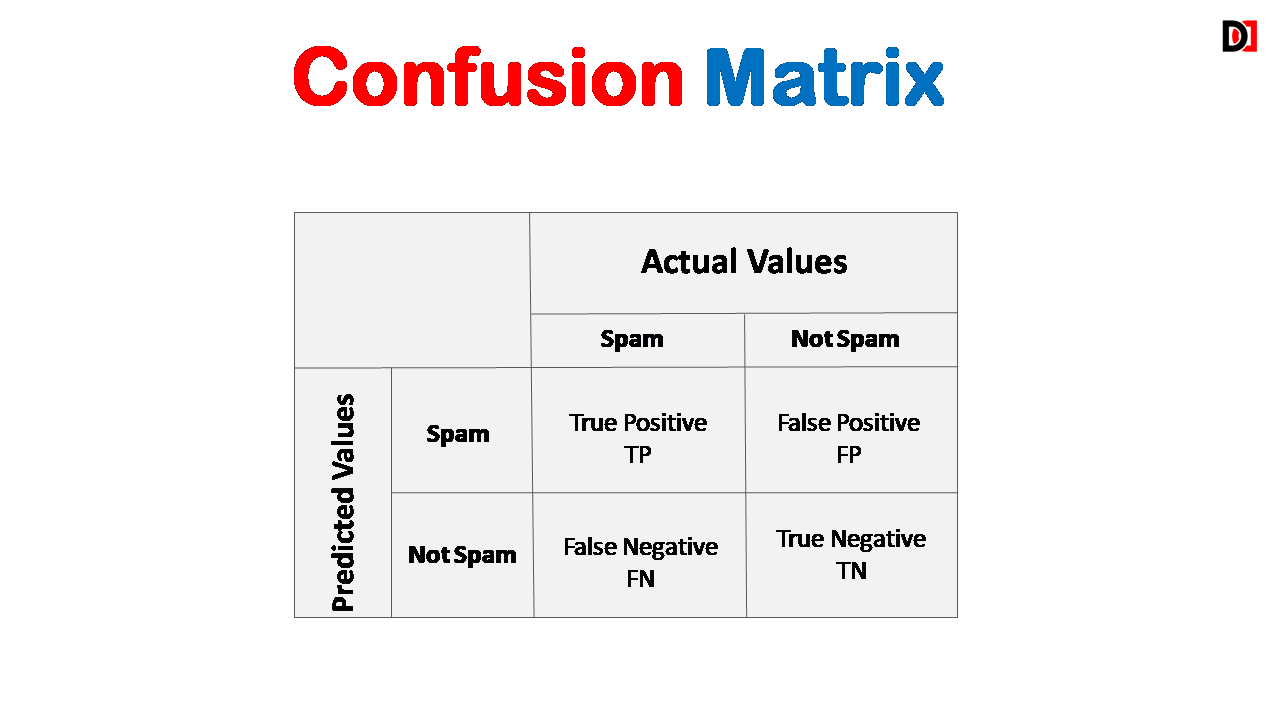
Key Components of a Confusion Matrix:
True Positives (TP): The number of instances correctly predicted as positive.
True Negatives (TN): The number of instances correctly predicted as negative.
False Positives (FP): The number of instances incorrectly predicted as positive.
False Negatives (FN): The number of instances incorrectly predicted as negative.
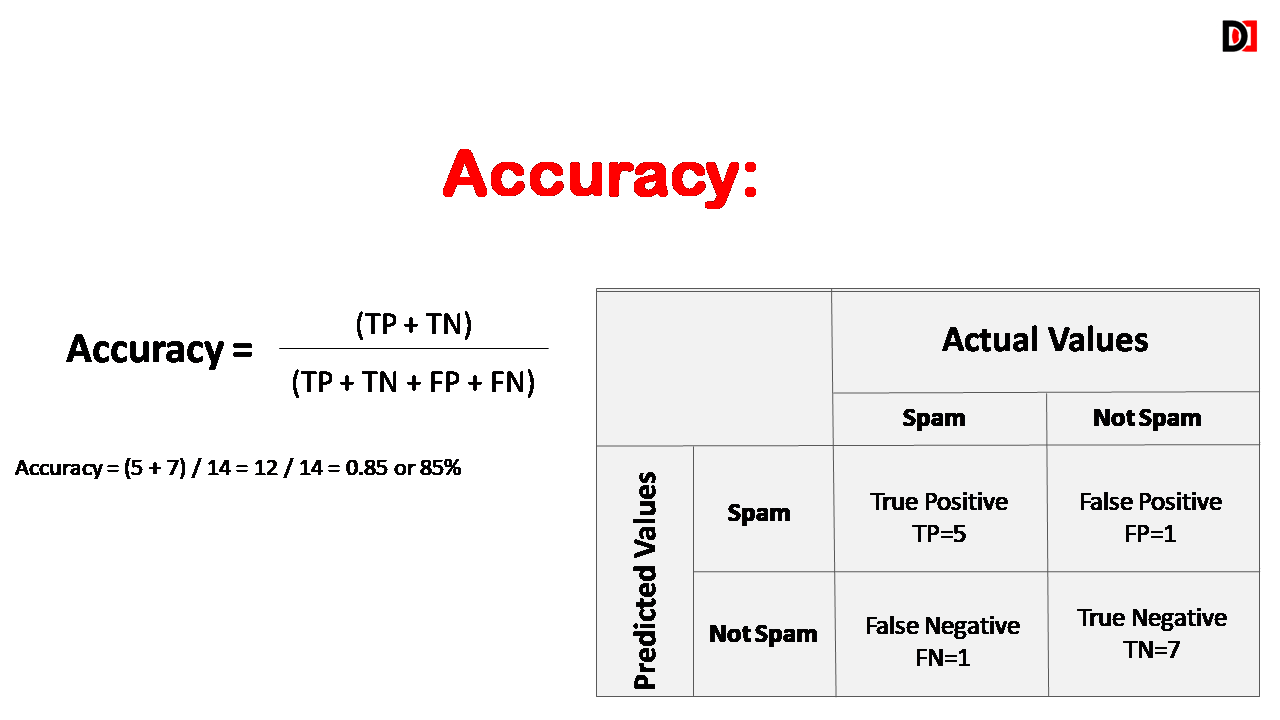
1. Accuracy
Accuracy is the percentage of all instances that were correctly classified. The overall proportion of correctly classified instances. Accuracy should be high as possible.
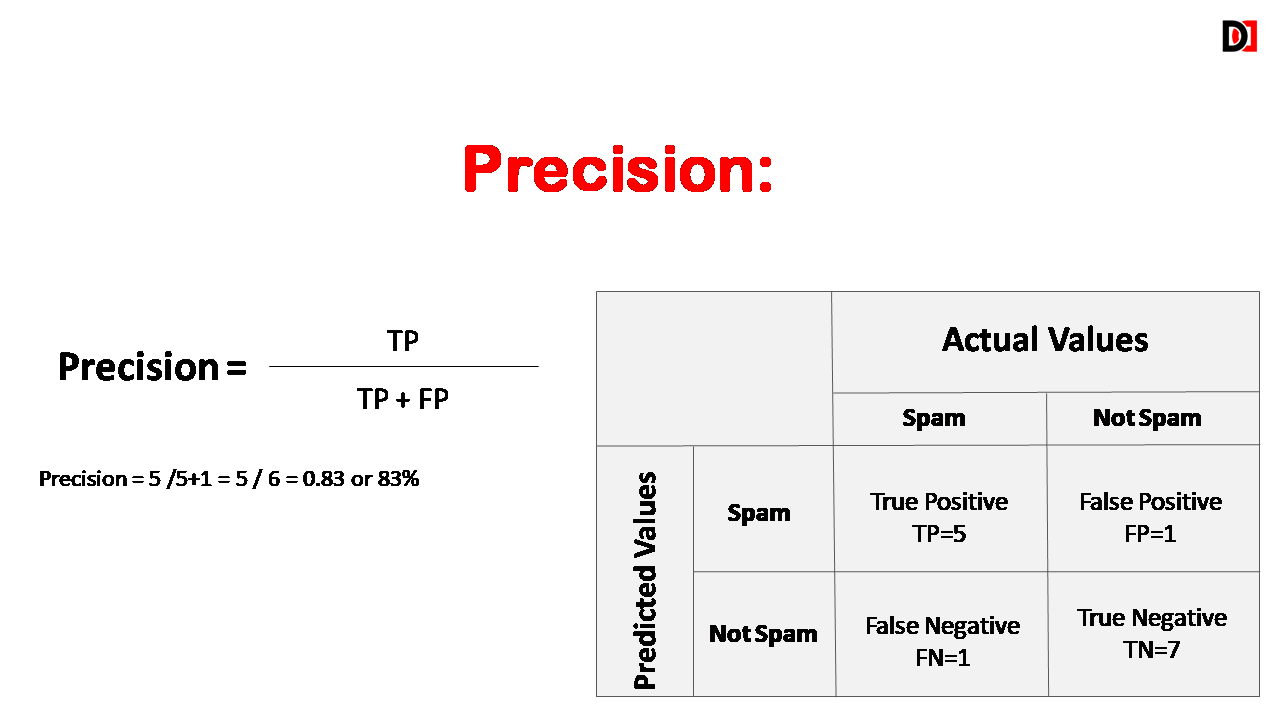
2. Precision
Precision is the percentage of instances that were classified as positive that were actually positive. Precision should be high as possible.
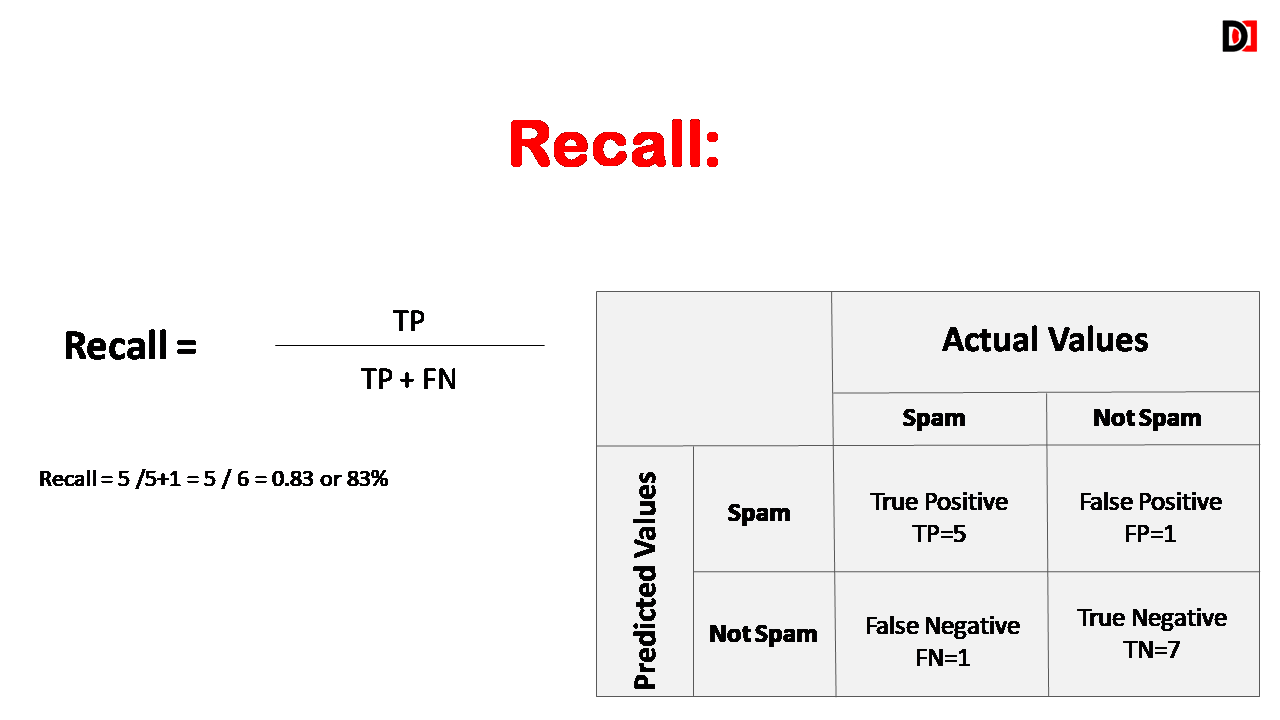
3. Recall (Sensitivity)
The proportion of actual positive instances that were correctly predicted as positive. Recall is the percentage of instances that were actually positive that were classified as positive. High recall indicates low false negative rate.
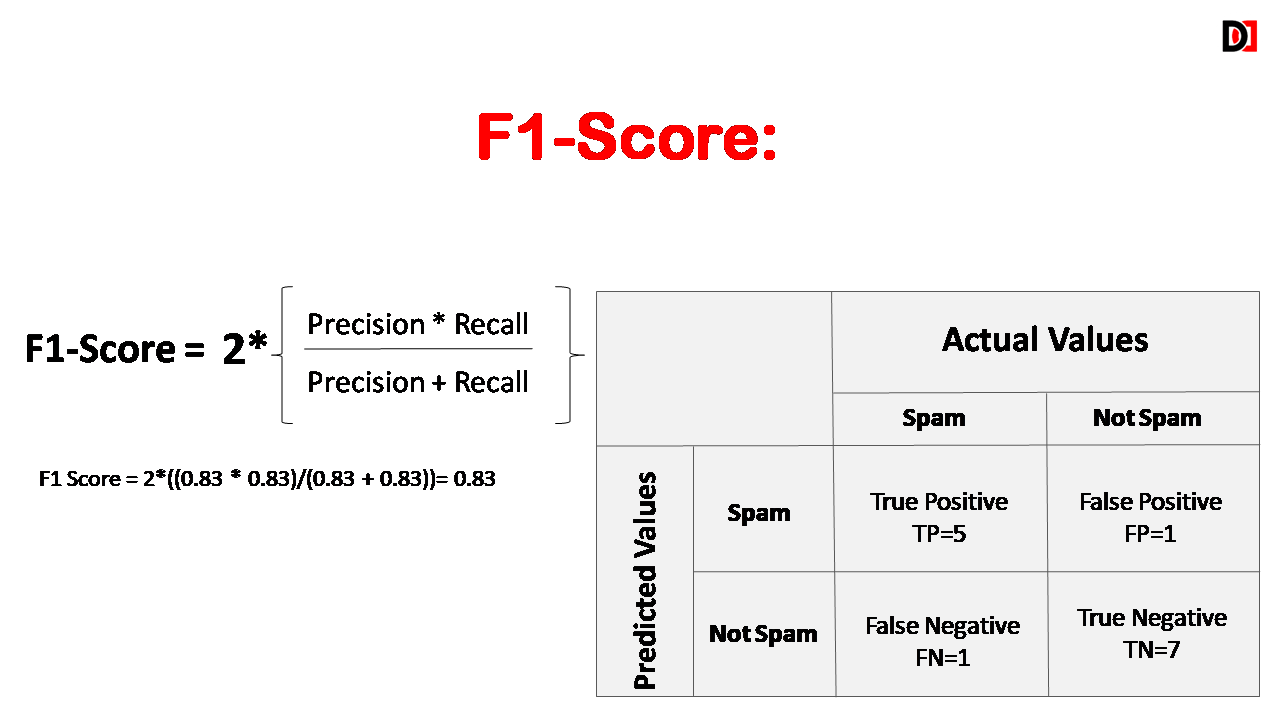
4. F1-Score
The F1 score is the harmonic mean of precision and recall. It provides a balance between precision and recall and is particularly useful when the dataset is imbalanced.
The Confusion Matrix is an indispensable tool for evaluating the performance of classification models. By understanding the key metrics derived from it, you can gain valuable insights into your model’s strengths and weaknesses, identify areas for improvement, and make informed decisions.


